Analyzing the Torah-Based Stock Prediction Algorithm
Introduction: Analyzing the Alternating Sector Algorithm
In this analysis, we explore concepts described in Anthony of Boston’s book A Torah-Based Stock Prediction Algorithm. Here we examine its unique market-timing system known as the Alternating Sector Algorithm, a method rooted not in traditional financial indicators but in the geometric relationship between the Sun and the Lunar Nodes. The algorithm divides the 360° ecliptic into twelve equal 30° sectors, beginning at a point 3° ahead of the lunar node. These sectors are then alternately labeled as “rise” or “drop” zones, creating a rhythmic sequence of bullish and defensive periods throughout the year.
The strategy operates with simple mechanical rules:
When the Sun moves through a “rise” sector, the algorithm takes long exposure to the Dow Jones — participating fully in anticipated upswings.
When the Sun enters a “drop” sector, the strategy either exits to cash or hedges, reducing exposure during periods that historically align with weaker market performance.
What makes this approach intriguing is that it requires no economic forecasts, earnings data, or macro analysis. Instead, it applies a fixed celestial rhythm to market timing, rotating in and out of the market as the Sun passes through these alternating zones. Over the past century, this simple geometric cycle has demonstrated a surprisingly consistent ability to capture a meaningful portion of upside while sidestepping major downturns, forming the foundation for more advanced variations like the Reversed and Hybrid Shmita Algorithms explored later in this article.
Building the Historical Dataset: 1897–2025
To evaluate the long-term effectiveness of the Alternating Sector Algorithm, we constructed a historical dataset of annual Dow Jones Industrial Average performance spanning 1897 through 2025. This dataset includes each year’s percentage change in the Dow, providing a clean baseline for buy-and-hold performance over more than a century of bull markets, crashes, wars, recessions, and technological booms.
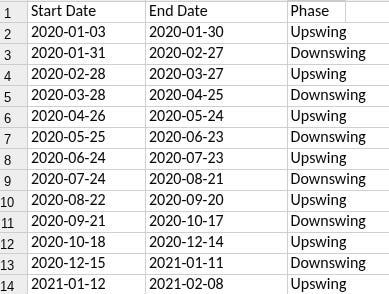
We then applied the alternating sector signals retroactively. For each year, the algorithm classified time windows as either “upswing” (rise sectors) or “downswing” (drop sectors) based on the Sun–Lunar Node geometry. The backtest assumed that an investor:
Held long exposure during upswing periods.
Moved entirely to cash during predicted downswings.
This simple binary rotation — in or out — was applied consistently across the entire 128-year span, with no discretionary changes or parameter tweaks. Importantly, this model does not attempt to predict magnitude; it merely follows the timing windows mechanically.
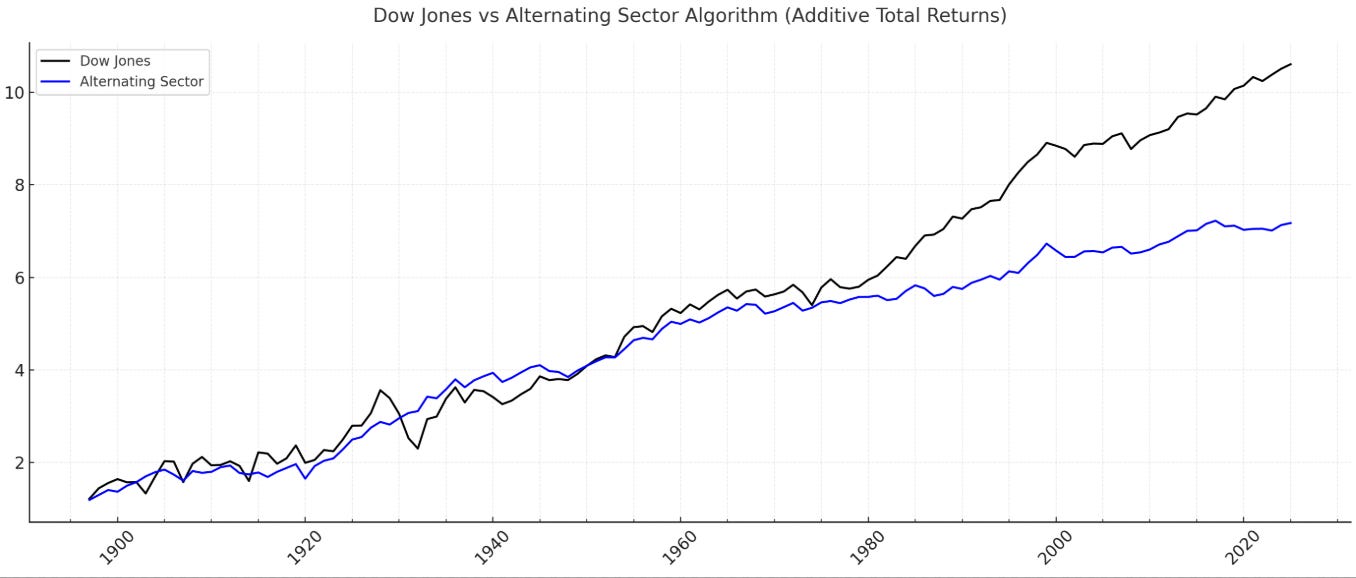
The results are revealing: while the Dow Jones (buy-and-hold) produced the highest nominal return due to full participation in all bull markets, the alternating sector strategy significantly reduced drawdowns during major crashes, including 1929–1932, 1973–1974, 2000–2002, and 2008.
By stepping aside during predetermined “drop” windows, the strategy avoided large portions of the worst downturns, resulting in smoother long-term growth and a total compounded return of roughly 630%, compared to the Dow’s 969% over the same period. This stability across multiple market regimes set the foundation for evaluating more complex variations — like the Reversed and Hybrid Shmita Algorithms — which build on the same underlying celestial rhythm
🔄 Reversed Alternating Sector: A Contrarian Twist
To further test the robustness of the timing windows, we applied the Reversed Alternating Sector Algorithm, which flips the original logic:
Long positions are taken during predicted downturn (drop) sectors, and
The strategy goes to cash during rise sectors.
This inversion creates a deliberately contrarian profile. Instead of aligning with the celestial timing for growth phases, it bets on strength during periods when the original model would be defensive.
When applied to the full dataset from 1897 through 2025, the reversed strategy showed inferior long-term performance compared to both the Dow and the original Alternating Sector Algorithm.
It underperformed in most historical periods, particularly during severe bear markets like 1929–1932 and 2000–2002, where it was fully exposed at the worst possible times. While the original algorithm was in cash during the Great Depression collapse, the reversed version was long, suffering large compounded losses.
However, this contrarian approach showed notable strength in the modern period, particularly 2020–2025. During this time, many of the “down” windows coincided with post-crisis rallies, stimulus-driven rebounds, and rapid V-shaped recoveries. As a result, the reversed strategy actually outperformed the original alternating algorithm over this five-year stretch. This illustrates that while the reversed model is historically unstable — amplifying drawdowns during classical crashes — it can capture upside in periods where traditional downturn signals fail, such as policy-driven rebounds or non-traditional market cycles.
Overall, the reversed alternating sector serves as a valuable contrast: a historically weaker, more volatile profile that occasionally aligns perfectly with unusual market phases, highlighting the sensitivity of cyclical timing to different eras.
Torah-Based Hybrid Shmita Algorithm: Integrating the Sabbatical Cycle
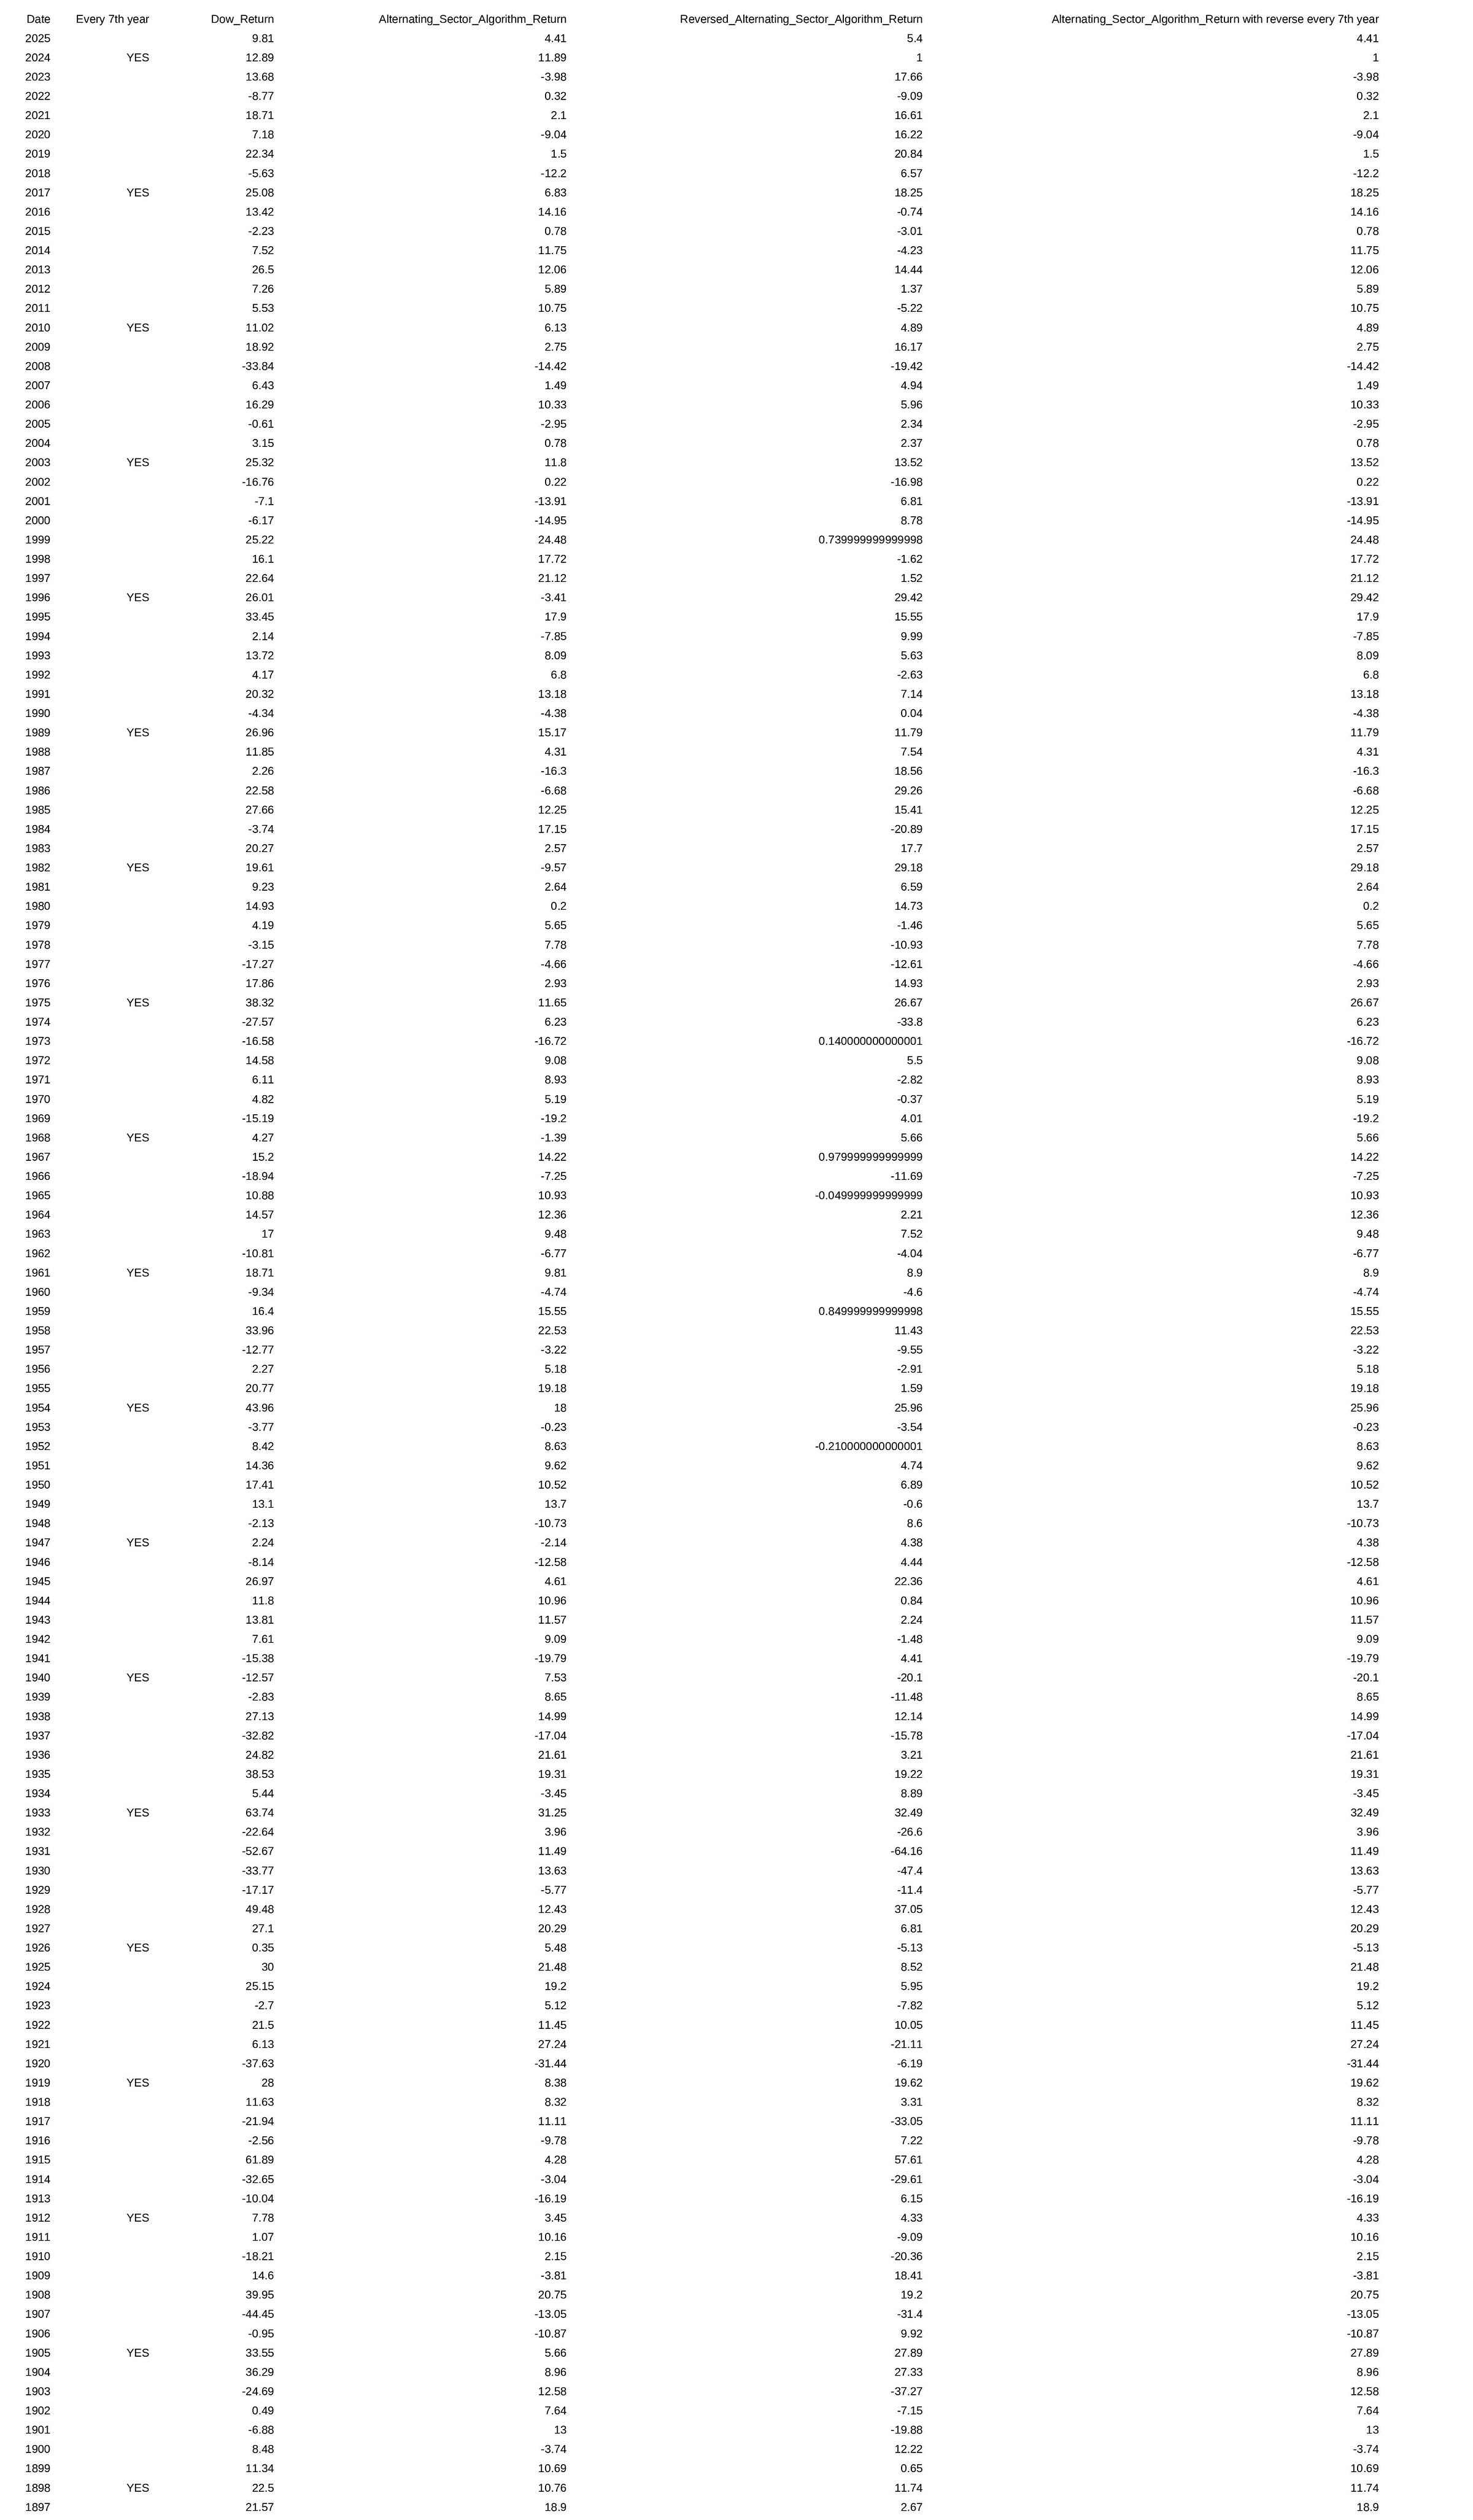
Building on both the original and reversed alternating strategies, we explored a third approach inspired by the Torah’s Shmita principle. In the Torah, every seventh year is set aside as a “Sabbatical year” (Shmita) — a period of rest and release. Applying this concept to the market-timing model, the Hybrid Shmita Algorithm follows the original alternating sector strategy, but every seventh year, the signals are reversed for that year alone, before reverting to the base logic in the following year.
For example, starting with 2024 and counting backward at seven-year intervals (2017, 2010, 2003, and so on, back to 1898), our designated (not actual) “Shmita years” use the reversed signal logic. All other years use the normal alternating sector structure. This periodic inversion introduces a cyclical “reset,” mirroring the Torah’s sabbatical rhythm.
When tested against the full dataset from 1897 to 2025, this hybrid approach produced significantly improved total returns compared to the base alternating algorithm.
The original Alternating Sector Algorithm generated roughly +630% over the entire period.
The Reversed Alternating Sector Algorithm generated roughly +339% over the entire period.
The Hybrid Shmita Algorithm, with reversals applied in every seventh year, increased that to approximately +720%, outperforming the base strategy by capturing gains in select reversal years while maintaining its defensive structure in others.
For comparison, the Dow Jones buy-and-hold returned around +969%, but with far higher volatility and exposure to catastrophic drawdowns.
Historically, many of the seventh-year reversals aligned with transitional market phases — such as post-crash rebounds, war-time recoveries, or regime shifts — allowing the hybrid to profit where the original would have sat in cash. Not every reversal was beneficial: for example, 1926 and 1940 saw weaker results, with the reversal underperforming the Dow. But in aggregate, the Shmita-based structure added performance without materially increasing drawdowns.
This fusion of astrological timing and Torah-inspired cyclical structure produced a strategy that was more adaptive across eras. It maintained the stability of the original algorithm through crises like 1929, while selectively benefiting from contrarian exposures in modern periods like 2020–2025, where traditional downturn windows coincided with powerful rebounds.
Historical Performance Highlights
1920s–1930s (Great Depression)
The Dow suffered catastrophic losses from 1929–1932.
The Alternating Sector Algorithm moved to cash during predicted downturn phases, largely sidestepping the worst crash years.
Hybrid Shmita further improved on some of these years by reversing signals in specific seventh years, capturing rebounds and avoiding false downturn signals.
1940s–1950s (Post-War Boom)
The Dow experienced a strong secular bull.
Alternating Sector participated in most rallies but occasionally missed early surges by exiting too early.
Hybrid Shmita reversed in 1940—a year where the reversal underperformed both the Dow and the base algorithm, showing that not every sabbatical switch was beneficial.
1970s (Stagflation)
Alternating Sector performed well by avoiding sideways, inflationary drawdowns.
Hybrid Shmita offered slight improvements in selected reversal years, benefiting from reduced whipsaw effects during transitional cycles.
The Dow mostly moved sideways in nominal terms while real returns were negative.
2000–2010 (Dot-Com & Financial Crisis)
The Dow experienced two severe bear markets.
Alternating Sector avoided significant portions of both declines.
Hybrid Shmita added further gains through strategic reversals, slightly boosting overall compounded returns compared to the base algorithm.
2020–2025
The Reversed Algorithm performed exceptionally well during this period. Post-COVID stimulus and atypical market behavior led to rallies during sectors traditionally marked as “down.”
Hybrid Shmita leveraged its 2024 reversal to capture this movement, significantly boosting its edge in the modern era.
A table of performance every 7th year
Quick summary of the table
Rows extracted: 19 reversal years (the ones you marked YES).
Hybrid vs Alternating: Hybrid is better than the Alternating Sector in 13 / 19 reversal years, worse in 6.
Hybrid vs Dow: Hybrid is better than the Dow in 4 / 19 reversal years, worse in 15.
Conclusion: A Century of Rhythmic Market Timing
The Alternating Sector Algorithm, grounded in the fixed celestial geometry of the Sun and Lunar Nodes, demonstrates that a simple, non-discretionary timing model can produce surprisingly stable returns across more than a century of market history. While it does not outperform the Dow Jones in raw nominal terms, its strength lies in risk management: by systematically stepping aside during historically weak periods, it avoided some of the most devastating drawdowns in market history — including the Great Depression, the 1970s stagflation era, and the 2000 and 2008 crashes.
The Reversed Alternating Sector Algorithm served as a deliberate stress test of the cycle’s robustness. Its historical underperformance highlighted the importance of aligning with — rather than betting against — these celestial rhythms. Yet its relative strength during 2020–2025 illustrates that no single timing model dominates in all eras, especially in periods characterized by unprecedented stimulus and policy intervention.
The Hybrid Shmita Algorithm, by integrating the Torah’s seven-year sabbatical rhythm, achieved the most balanced profile. Through periodic signal reversals in designated Shmita years, it captured contrarian gains during transitional phases while preserving the original algorithm’s defensive character. Over the full 1897–2025 period, this hybrid produced a higher total return than the base strategy, with similar or lower drawdowns.
Taken together, these results suggest that celestial-based market rhythms — far from being mere curiosities — can serve as stable structural overlays for timing decisions. While no algorithm is perfect, the Alternating Sector and Hybrid Shmita strategies illustrate how fixed temporal frameworks can offer resilience across radically different market regimes. They invite a rethinking of market timing: not as short-term forecasting, but as aligning investment exposure with durable, repeatable temporal cycles that transcend individual eras.


